Every country spends money differently, but the largest expenditures are typically on defense, health, and education.
Factors like population size and the political environment influence how much is allotted to each category.
As you compare the figures, you’ll also want to keep in mind the economic situation of the countries listed. Here are some of the figures we cite to compare the economic health of the nations below:
- Gross Domestic Product (GDP) — the total value of everything produced by all the people and companies in the country over a specified period of time.
- GDP per capita — the GDP divided by the population.
- Government budget — Amount government allocates for all expenditure for the year.
Military Spending
Global defense spending is on the rise, especially in Eastern Europe.
To build up the military, a government must either increase revenues, change its the budget or increase the percentage of the GDP used for defense.
Military Spending Around the World (%GDP) in 2016
Military spending is important to most nations, with each country spending to its own need and ability.
- In North America, Canada spent 1.0% of its 2016 GDP on military spending, the US spent 3.3%, and Mexico 0.6%.
- In South America, Nicaragua spent 0.5% of its 2016 GDP on military expenses. In Columbia, military spending was 3.4% and Argentina's military spending was 1.0%.
- Among European countries, military spending has been on the rise. Norway spent 1.6% of its budget on military spending, while its neighbor Sweden spends 4.3%. In the U.K., the defense spending was 1.8% of the country's GDP. In Germany, it was 1.2 %. In France, military spending was 2.3%, Italy was 1.5%, and Spain is 1.2%.
- In the Middle East, the level of military spending is generally higher than in Europe. Iran's military spending was 3.0% of its GDP and Pakistan was 3.6%. Saudi Arabia spent a whopping 9.8% of its annual GDP on the military.
- In Africa,the military of South Africa used 1.1% of its GDP and Morocco spent 3.2%.
- In Asia, India's military spending was 2.5%of its GDP. Thailand spent 1.4% and Indonesia spent 0.9%. China spent 1.9%, while Russia spent 5.4%.
- In the Pacific, Australia spent 2.0% of its budget on its military.
In 2018, Europe's defence spending is also expected to rise by 1.6%.
Eastern Europe will have the fastest growth of defense spending in the world, nearly doubling spending from 2014.
Russia's defense spending will fall for the second year in 2018, reducing its GDP percentage on the military by 5%.
Healthcare
Another big ticket item in the budgets of many countries is healthcare.
Although the US spends the most on healthcare per person, it doesn't mean that Americans are healthier than those in other developed countries.
In fact, the US doesn't crack the top 20 countries with the lowest infant mortality rates.

The US doesn't make it on the list of countries with the highest life expectancy rates either.

US adults with chronic conditions very costly
Americans suffer more chronic conditions than other countries including arthritis, asthma or chronic lung disease, diabetes, heart disease, and hypertension.
Of the $2.7 trillion annual health care expenditures in the US, 86% is spent on those with chronic and mental health conditions.
The most recent statistics show that cardiovascular disease averages $316.1 billion every year with $189.7 billion spent on direct medical expenses and $126.4 billion reflecting lost productivity costs.
In 2017, the total healthcare costs of diabetes was estimated at $327 billion.
Caring for those with diabetes takes 1 of every 4 dollars of US healthcare expenditure. Arthritis, another wide-ranging chronic condition in the US, affects more than 7 million people and is the leading cause of disability.
Total cost for caring for those with arthritis is estimated at $65 billion annually.
What is Universal Healthcare?
The World Health Organization (WHO) defines universal health coverage as a system where everyone has access to quality health services and is protected against financial risk incurred while accessing care.
Among the 35 Organisation for Economic Co-operation and Development (OECD) members, 32 out of 35 have passed legislation for universal healthcare.
Germany: German workers pay about 15% of their monthly salary to universal healthcare, half in paid by employers.
UK: All health services are free to citizens, but the system is almost broke from a funding gap in the billions.
France: Patients pay the doctors upfront and the state reimburses part or all of the bill. Workers pay a percentage of their salaries to the state funds for reimbursement.
US: The closest the US has come to universal healthcare was 2010's Obamacare, although 26 million Americans remain uninsured.
Total Health Expenditures by Country per person 2016
The average amount spent on health per person in countries comparable to the US was $4,908 – just more than half that of the U.S. ($10,348).
- United States: $10,348
- Switzerland: $7,919
- Germany: $5,550
- Netherlands: $5,385
- Austria: $5,227
- Belgium: $4,839
- Canada: $4,752
- Australia: $4,708
- France: $4,600
- Japan: $4,519
- United Kingdom: $4,192
Although the US spends the most, healthcare spending has slowed down more than other developed countries.

The US also spends more from the private sector than the public sector on healthcare.

The last big government expense is education.
Schools that provide daily studies for children until the age of 16 can be very costly, but it isn't just the amount a country spends to educate its students that reveals their priority, sometimes the percentage of the GDP reserved for education is better indicator.
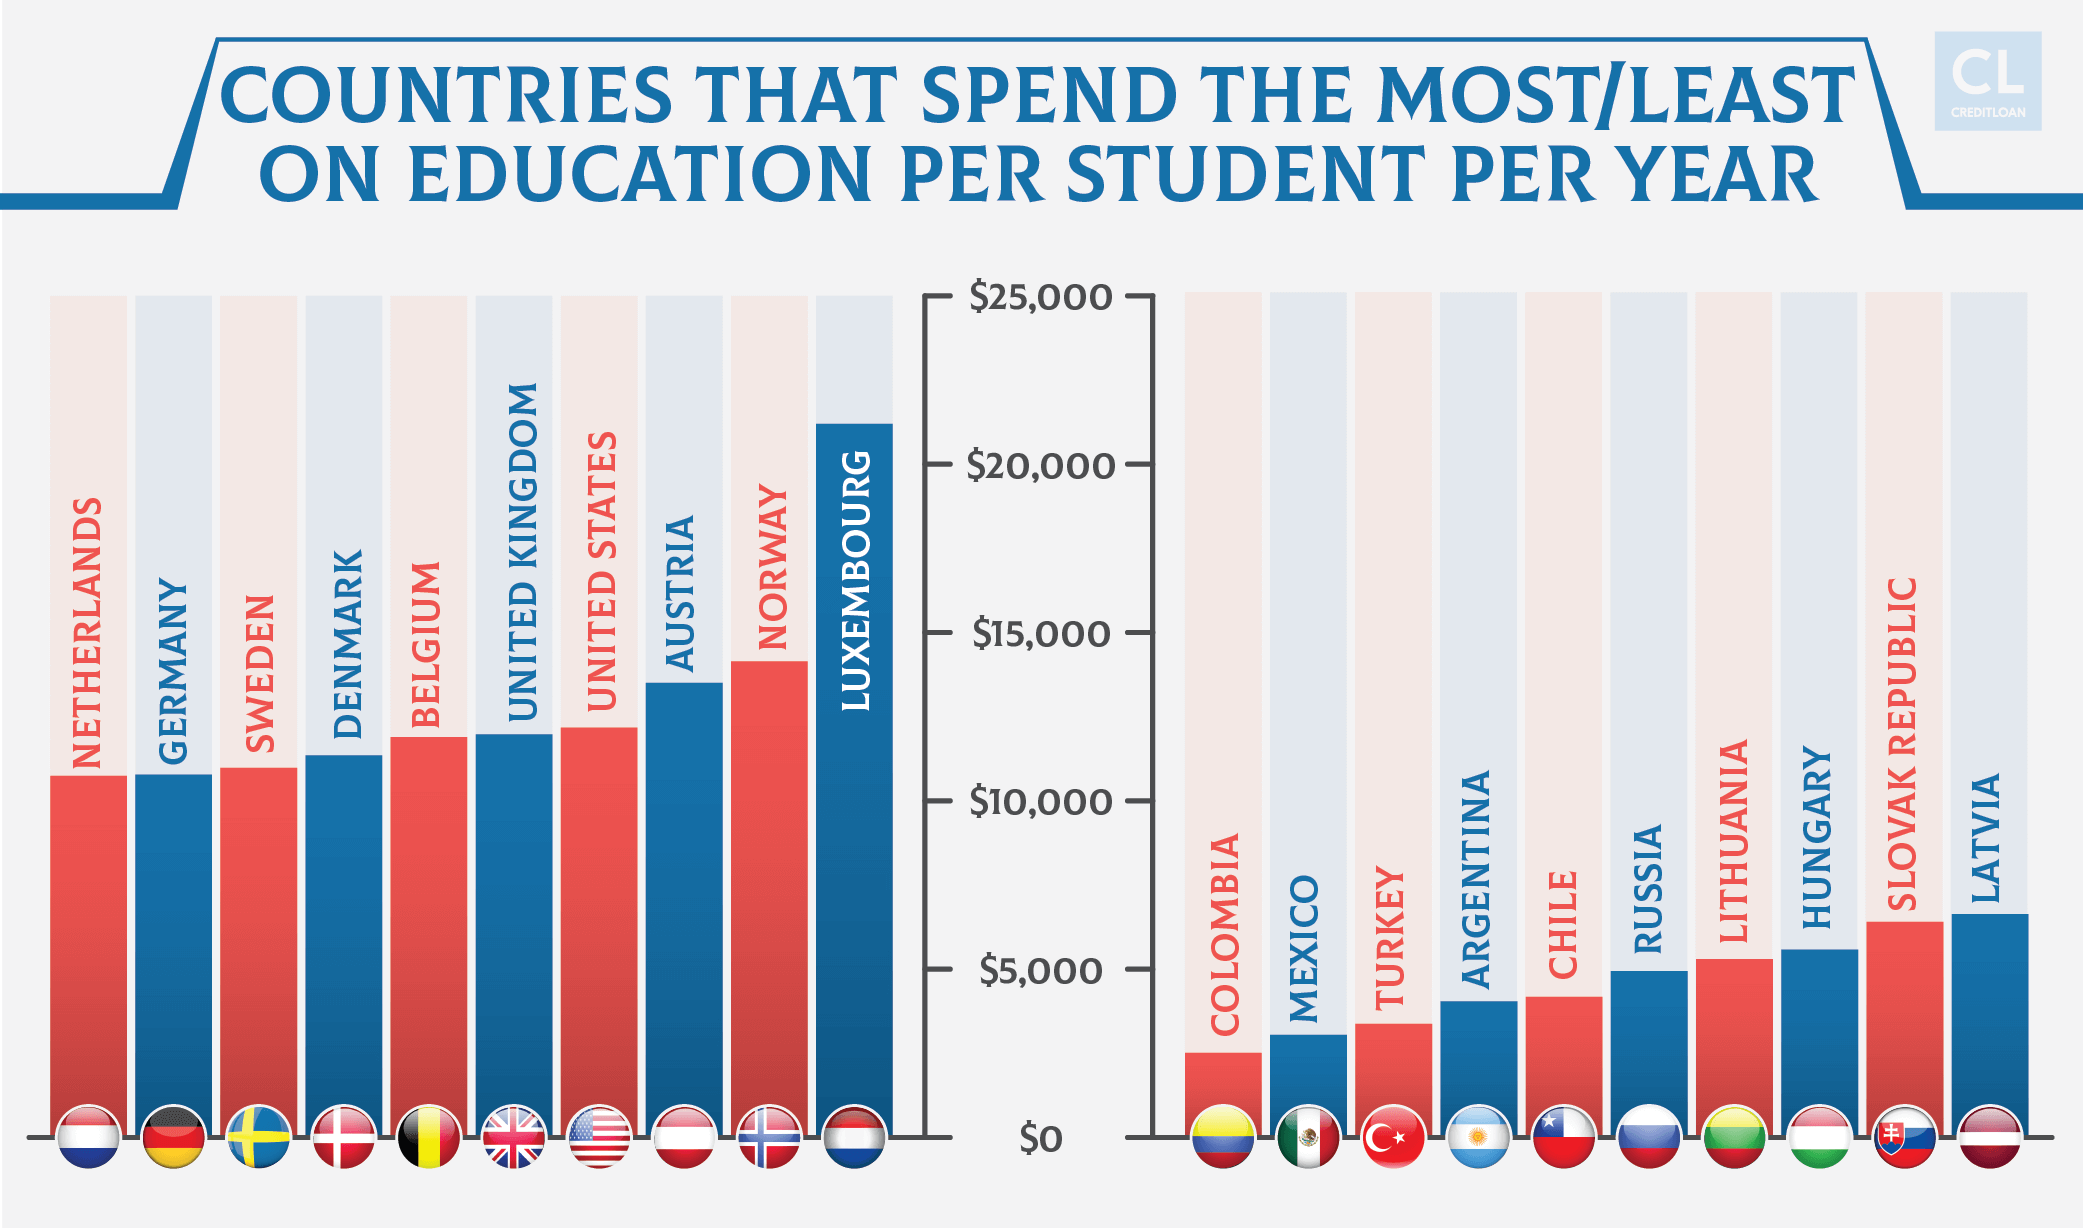
For example, in the most recent available statistics from 2014, Mexico falls in the top 10 of countries that spend the least amount ($3,049 per student per year) on education, but in terms of how much of its GDP is spent on education, it falls into the top 10 highest with 2.0%.
Countries that Spend the Highest and Lowest Percentage of GDP on Education

A recent study by the Organization for Economic Co-operation and Development (OECD) found that 85% of young adults (aged 25 to 34) in member countries had finished high school in 2017. Just under half have gone on to a post-secondary education. Countries with the highest number of young adults with university degrees are: Korea (70%), Canada (61%), Russia (60%) Japan (60%), Lithuania (55%) and Ireland (52%).
Best Countries for Education
The percentage of GDP spent on education does not guarantee a higher ranking for countries with best education systems.
In a global survey released last year by Y&R, BAV, The Wharton School and US News had some interesting results in terms of how education systems in different countries are perceived.
Respondents were asked to rank the countries on three considerations: well-developed public education system, would consider attending a university there, and provides top quality education.
The top five countries were:
1.UK. Education is mandatory from ages 5-16, and students are taught a national curriculum comprised of four educational stages.The UK has several highly respected universities and learning institutions.
2. US. Students attend kindergarten through high school for free, and about 70% choose to go on to post-secondary education. The US has several highly respected universities.
3. Canada. Free primary and secondary education is mandatory until the age of 16. Students are taught in English or French, and can attend public or Catholic schools. After high school, students can attend a university or college based on the schools' acceptance.
4. Germany. The concept of kindergarten was developed in Germany, so it's no surprise education is important to its people. German student attend primary school in four grades and then take one of three tracks to higher education: college-bound, secondary school or trade school.
5. France. Education is mandatory from ages 6-16, and all students study a national curriculum that is steeped in philosophy. Graduates are all expected to write a philosophy paper.
Why Government Spending Matters
We should all be aware of how our government handles the country's money.
The federal budget establishes the spending priorities of the country and affects every one of its citizens.
Economic health drives policy makers and influences the lives of everyone.


